Interactive demo
Measure a real angiogram in your browser.
A frame from the ARCADE public dataset. The vessel outline is the application's own segmentation, not an expert annotation. Mark the start and end of a segment; the measurement runs in your browser and reports what the application reports.
- 01 Hover the vessel — the marker snaps to it
- 02 Click the start, then the end
- 03 Read the measurement panel
- Start
- End
- Measure
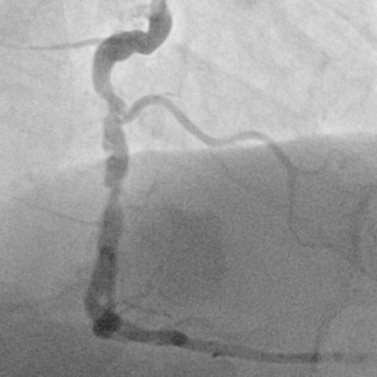
Click the start of the vessel segment
Click the start of the vessel segment
Reading the panel
What the measurement reports.
- Proximal and distal diameter
- The vessel diameter near each end of the segment you marked, taken as the median over its first and last 15 px.
- Minimum lumen diameter (MLD)
- The narrowest point between the two ends.
- Reference diameter
- A taper fitted through every healthy part of the segment — what the vessel would measure at the MLD if it were not narrowed.
- %stenosis (%DS in the panel)
- How much narrower the MLD is than the reference at the same point: (1 − MLD ÷ reference) × 100. Shown as n/a when no healthy part of the segment can be fitted.
- Plaque (orange fill)
- Where the vessel falls more than 5% short of the fitted reference, the space between the measured walls and the reference diameter.
This frame carries no calibration, so results are in pixels. In the application, measurements are in millimetres when the study carries C-arm geometry or the operator calibrates on the catheter.
See the full application, or ask to run it at your site.